Helpdesk reports and analytics
for decision making,
not guesswork
Raiseaticket’s free helpdesk reveals critical insights for optimizing customer support processes. By diving into reports, you can quickly transform challenges into opportunities.
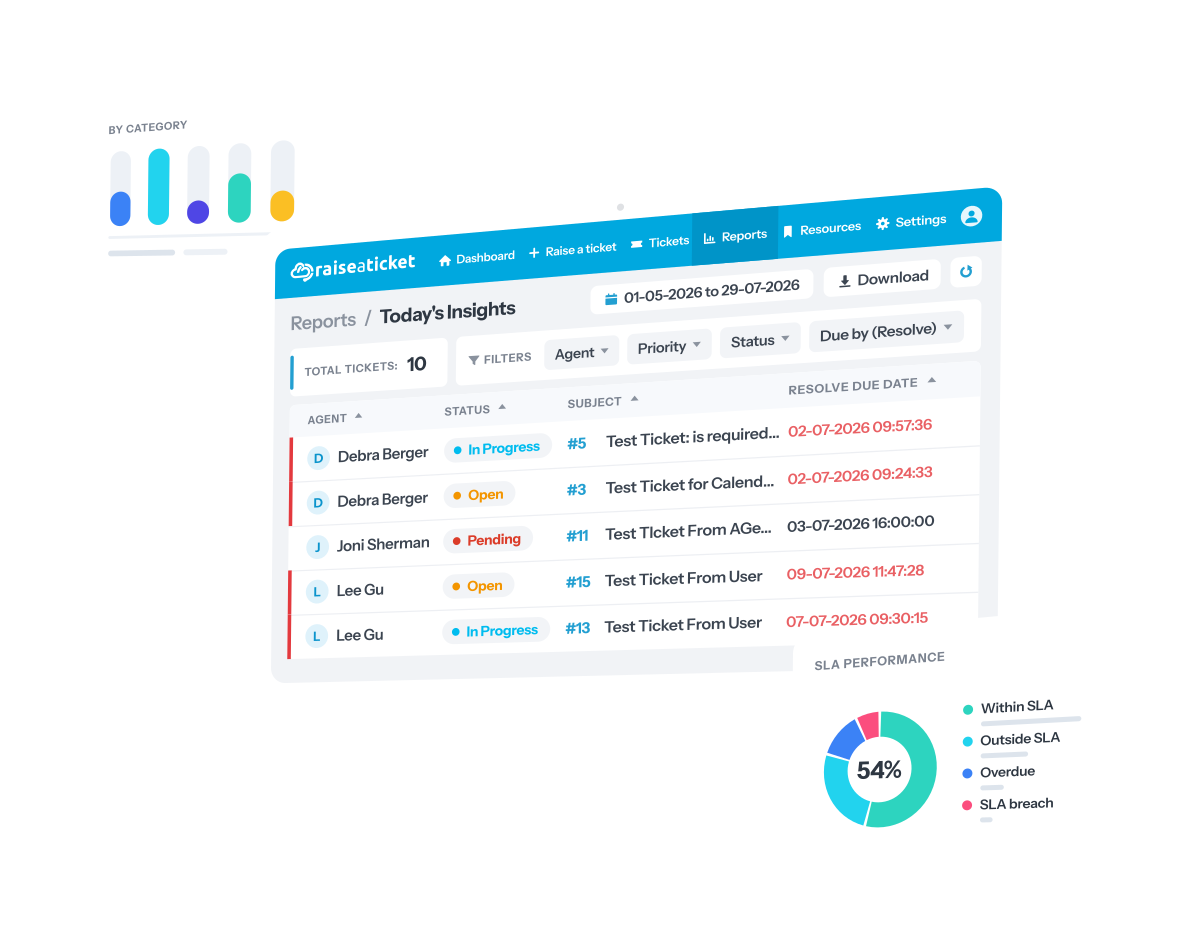
Priority, response, and resolution
Our key metrics serve three essential purposes: define clear expectations for customers, prioritize tickets for faster resolution, and evaluate helpdesk performance.
Support process identification and evaluation
Regular reporting uncovers trends in customer service experiences, anchoring customer-focused decisions at the heart of your support strategy.
Raiseaticket’s free helpdesk reports highlight key metrics, such as average resolution time, SLA breaches, and response times. By tracking these, you can continually enhance the customer support experience, making response time a cornerstone of service excellence.
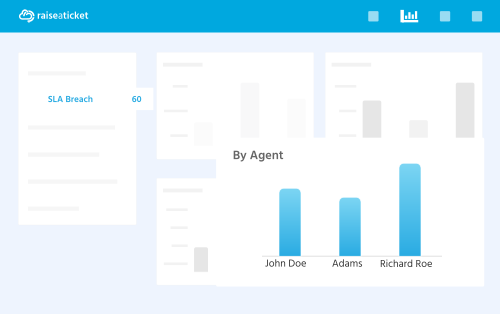
Prioritization
Customers expect a quick response if it’s a low-priority ticket and don’t like to repetitively point out a single issue. It’s difficult to prioritize and efficiently manage your support inbox, especially between team members.
Raiseaticket provides the most equitable way to handle the tickets based on priority and the order they are received. Today customers just don't buy products or services, they value more the experience.
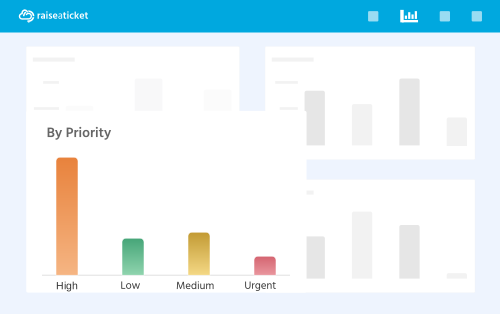
Simplification
Every organization must determine which support areas would benefit most from simplification depending on its unique support context and circumstances.
Customers prefer a simple tool that suits their support journey adequately. With raiseaticket free helpdesk you can deliver a low-effort, high-quality service with fewer channels.
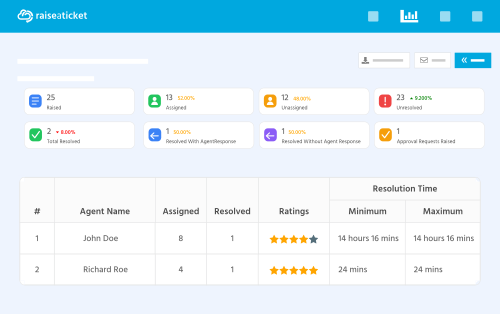
Monitor performance
Gaining in-depth knowledge about customers isn't something that just happens. Raiseaticket free helpdesk’s unmatched combination of simple and data-driven reports steer your business toward the right decisions on the issues that matter most: optimization of the existing processes and improving productivity benchmarks.
Analyze your service performance with our pre-built insights and dashboards with the key metrics. For instance, you can filter and download the tagged tickets to ensure the relevant tickets are included in the context search.
Read more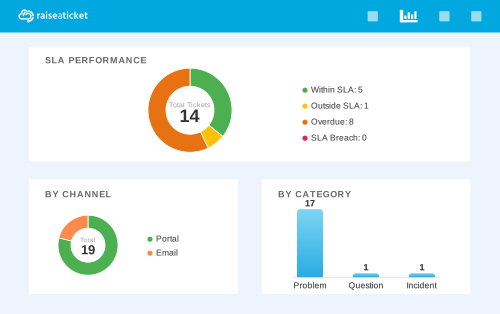
Which numbers actually change a decision
Reports are only useful if a figure moving causes you to do something differently. These are the measures that tend to earn their place, and what each one is really telling you.
First response time. Usually the strongest driver of how supported a customer feels, and often more important to them than how long the complete fix takes. It is also the earliest warning that a team is stretched, moving well before resolution times do.
Resolution time. Only meaningful read alongside volume. The same average means something quite different in a week when incoming tickets doubled, and comparing the two months in isolation will mislead you.
Received against resolved. The single clearest measure of whether you are keeping pace. If received consistently outruns resolved, the backlog is growing however hard the team works, and the fix is either more capacity or fewer tickets arriving. No amount of process change closes that gap.
SLA breaches. Worth reading by department and priority rather than as one total. A single number tells you that you missed targets; the breakdown tells you which queue to look at, which is the part you can act on.
Reopen rate. The quietest quality signal and the easiest to ignore. Tickets closed and then reopened usually mean the first answer addressed the symptom. A team with fast closure times and a rising reopen rate is not performing well, it is closing early.
Volume by category. The route to reducing work rather than absorbing it. A category that dominates your volume is either a product problem worth fixing at the source or a missing knowledge base article. See knowledge base.
Reporting is included in the free plan rather than reserved for a paid tier, which is worth comparing directly when you evaluate alternatives. For the live day-to-day view use the dashboard, and see pricing for what the plan includes.
All in one platform
Product questions, service requests, incidents and updates - your experts handle all of it on a 100% free cloud helpdesk.