Helpdesk agent performance reports that show what support is actually doing
Ticket volume is not just data, it is a planning tool. Seeing what arrives, who handles it and how long it takes lets you forecast workload, plan shifts and make hiring decisions on evidence rather than instinct.
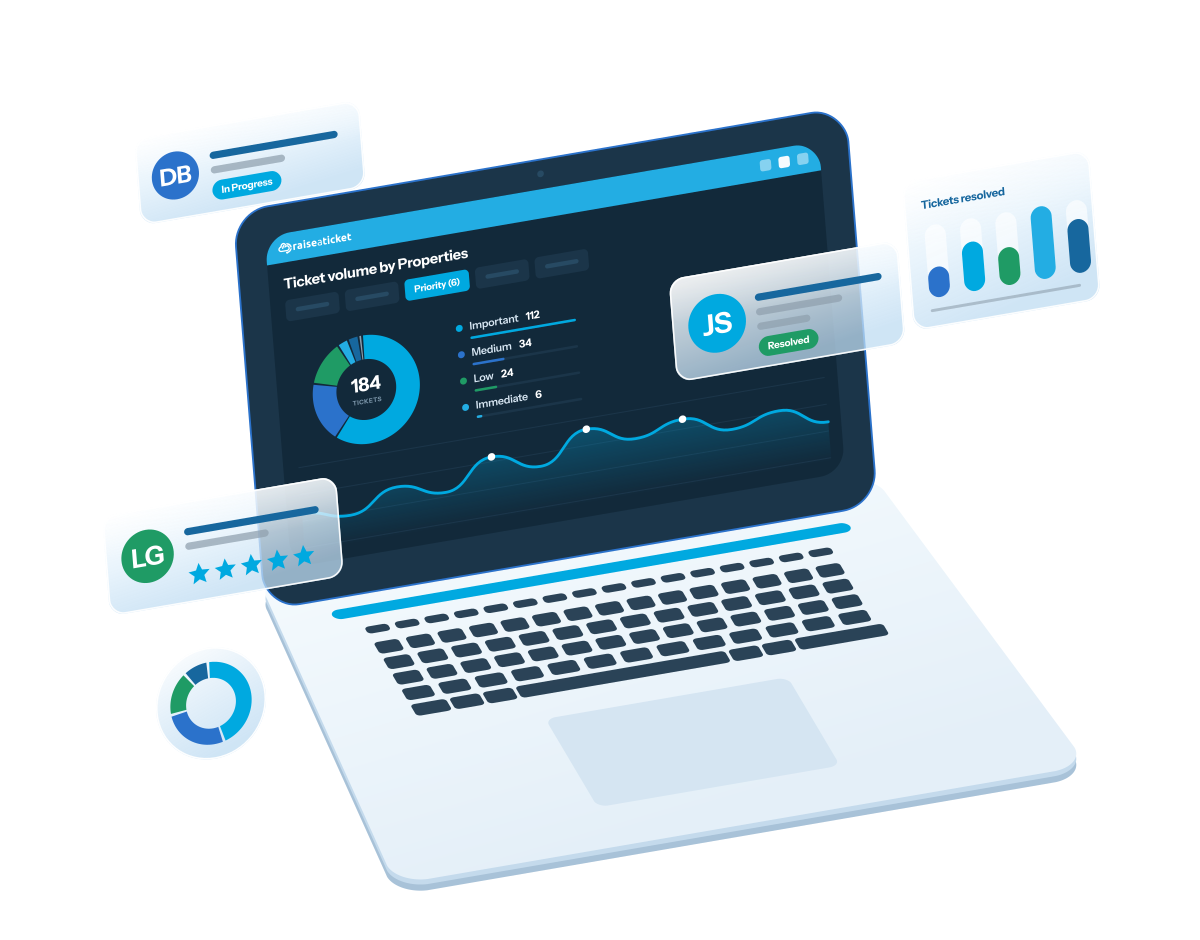
Catch a backlog while it is still small
Backlogs rarely announce themselves. They build quietly until a customer complains. SLA breach reports and agent queue analytics show you where work is slipping, and crucially why, while there is still time to do something about it.
- Spot weak points in your workflow
- Balance ticket routing and agent load
- Base hiring and training on evidence
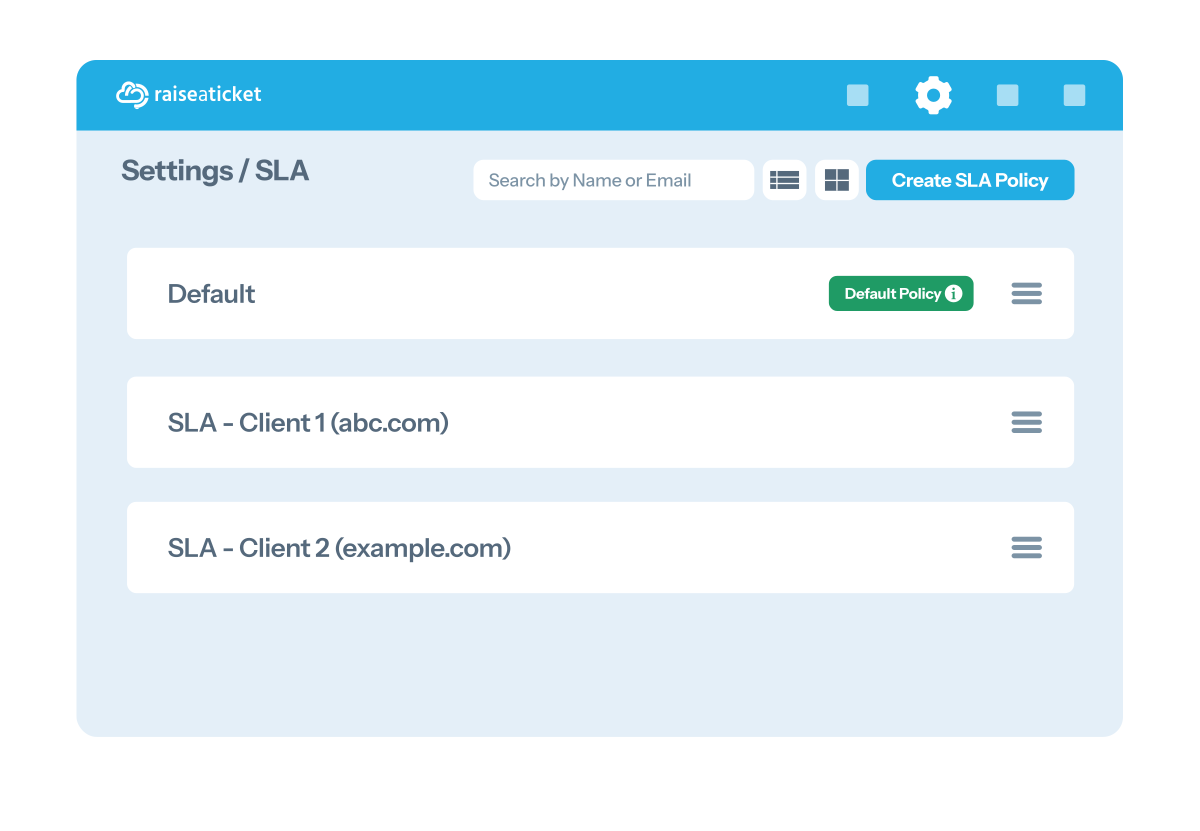
Set the standard, then check you are meeting it
Define SLA policies around what your customers actually need rather than a round number, then monitor compliance across every channel. Read breaches by department and priority instead of as one total: a single figure tells you that you missed, the breakdown tells you which queue to look at.
See SLA management for how targets and operational hours are configured.
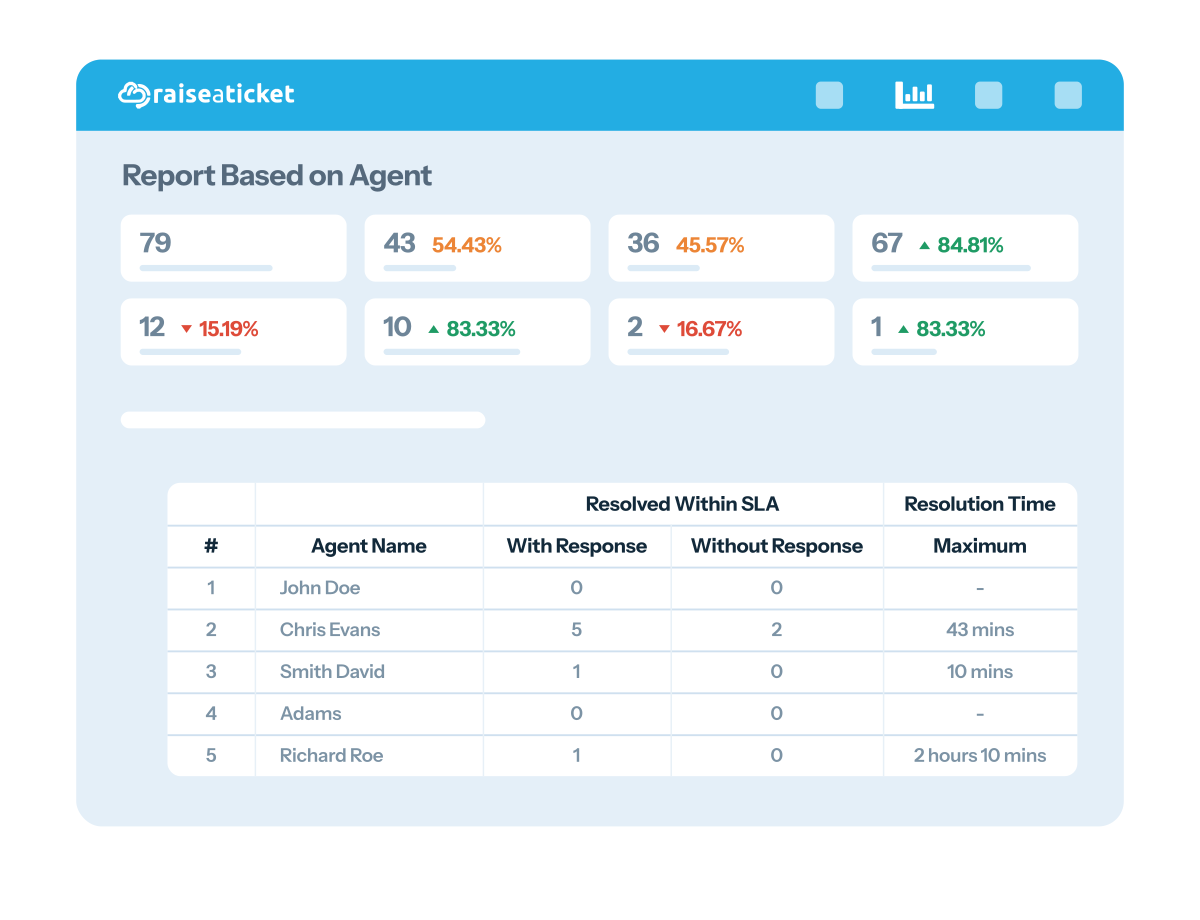
Measuring agents fairly
Agent metrics go wrong when they are read as a league table. Volume in particular says more about what an agent was assigned than about how well they worked, and ranking a team on it quietly encourages cherry-picking the easy tickets.
Tickets resolved, in context. Useful for spotting an uneven distribution of work, not for ranking people. An agent handling complex escalations will resolve fewer than one answering password resets, and that is the system working correctly.
First response time. Largely within an agent's control, which makes it a fairer individual measure than resolution time, which often depends on other teams.
Reopen rate. The clearest quality signal. Consistently low reopens alongside moderate volume is a stronger performance than high volume with frequent reopens.
Workload distribution. Read this across the team rather than per agent. A queue where one person carries a disproportionate share is a routing problem, and it usually shows up as burnout before it shows up in the numbers.
Tracked together, these are the KPIs that let you improve operational efficiency, reallocate people where they are needed, and keep the experience consistent rather than merely fast.
What to do when a figure moves
A report is only worth running if something changes as a result. These are the four readings that most often justify a decision, and the decision each one points to.
Volume is climbing in one category. This is a demand problem, not a staffing one. Before adding capacity, check whether a single recurring issue is generating the tickets. Fixing the cause, or publishing one knowledge base article, usually removes more work than another agent adds.
First response is slipping but resolution is steady. The team is stretched at the point of triage rather than at the point of fixing. Look at routing and who picks work up first, not at how long fixes take.
Breaches cluster in one department. Either the target is wrong for that queue or the queue is under-resourced. Both are fixable, and the breakdown tells you which conversation to have.
One agent is well above the others on volume. Read it as a routing signal before a performance one. Uneven distribution is usually how the queue is configured, and it tends to surface as burnout well before it shows up as a falling number.
Reviewed on a regular rhythm rather than only when something goes wrong, these readings turn reporting from a record of what happened into a way of deciding what to do next.
Performance reporting, answered
Is agent reporting included in the free plan?
Yes. Agent and department reporting is part of the free plan, which covers 5 agents and 500 tickets a month with no credit card. Reporting is one of the things most vendors reserve for a paid tier, so it is worth comparing directly. See pricing.
Can we compare departments as well as individuals?
Yes. Performance can be read by department and group as well as by agent, which is usually the more actionable view once teams handle different classes of work. See reports and analytics.
How does this relate to SLAs?
SLA policies define what on time means; agent reporting shows who is meeting it and where the misses cluster. The two are read together. See SLA management.
Can agents see their own figures?
Visibility follows agent privileges, so you decide who sees team-wide performance and who sees only their own work.
What is the difference between this and the dashboard?
The dashboard is the live view for day-to-day work: what is open, pending or overdue right now. Performance reporting is for trends over a period, agent and department comparisons, and exportable detail.
Start measuring what matters
Raiseaticket is built for teams that care about customer experience and operational excellence. Free forever, with no credit card required.
Free foreverNo credit cardNot a 6-month trial